Free petrophysics software for quick-look log analysis
Compute shale volume, porosity, water saturation and net pay from LAS files in your browser, summarize them by zone, and check the answer on crossplots. Every equation and default is documented, so you can see exactly how each number was made.
Open Weller Logs, freeRead the methods
What it computes
| Property | Methods |
|---|---|
| Shale volume (Vsh) | Gamma-ray index, linear, Larionov (Tertiary and older rocks) or Clavier; SP when gamma ray is missing |
| Porosity | Density, neutron-density total and effective porosity, with the matrix matched to the neutron's calibration |
| Water saturation (Sw) | Archie or Simandoux, on total or effective porosity, with Rw corrected for formation temperature |
| Total organic carbon | Passey ΔlogR from sonic or density and resistivity |
| Net reservoir and net pay | Vsh, porosity and Sw cutoffs, with bad-hole flags from caliper and density correction |
Computed curves are added to each well, so they plot, crossplot, average and export like any other log. The equations, defaults and their limits are on the methods page.
Zone statistics and crossplots
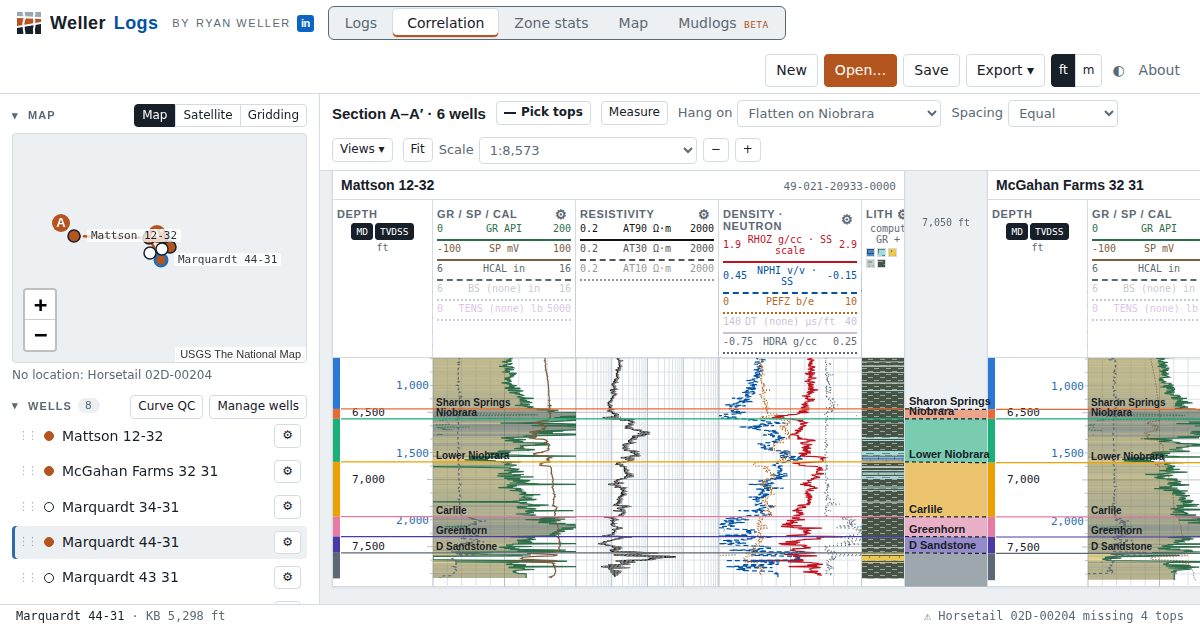
Pick tops to define zones, and the Zone stats tab summarizes each zone in each well: gross and net thickness, net-to-gross, net pay, average porosity and Sw, porosity-feet and hydrocarbon-feet, using true vertical thickness in deviated wells. Box plots compare zones and wells. Crossplots check the interpretation:
- Neutron-density with sandstone, limestone and dolomite lines, for lithology and gas effect.
- Pickett plot of resistivity against porosity with Sw lines, to check Rw and the cementation exponent.
- PE-density with matrix points, for mineralogy.
- Any two curves, colored by zone, gamma-ray band or well.
Everything exports as CSV, and a petroplots export feeds publication figures in Python.
Transparent by design
Quick-look petrophysics is only as good as its parameters. Weller Logs shows them: GR clean and shale baselines per well, matrix density, a, m, n and Rw with its temperature, in one Interpretation panel saved with the project. Automatic GR baselines exclude organic-rich and uranium-rich shales, which would otherwise make ordinary shale look clean. Change a parameter and every track, zone total and crossplot updates.
Where AI fits in petrophysics
Machine learning is good at predicting missing logs, classifying facies and electrofacies, and flagging bad data across hundreds of wells. It is only as good as the logs and labels it learns from, and its answers still need a petrophysicist to judge them. Weller Logs keeps the core interpretation deterministic and documented, so every number can be traced to an equation. That makes it a good place to quality-check logs and build consistent zone tops, the groundwork any AI workflow depends on. For AI workflows built on your own data, see the consulting note below.
What it is not
This is screening petrophysics: fast and consistent, for comparing wells and zones, choosing intervals and checking a story. It does not replace a full multi-mineral solve, core calibration or a petrophysicist's review for reserves or completion decisions.
Questions
Is the petrophysics free?
Yes. All interpretation, zone statistics, crossplots and exports are free in the browser, with no sign-up.
Which water saturation models are available?
Archie and Simandoux, on total or effective porosity. Rw is entered with its temperature and corrected to formation temperature along the well.
Can I set my own parameters?
Yes. GR baselines can be set per well, and matrix, a, m, n, Rw and the net pay cutoffs are all in the Interpretation panel, saved with the project.
Does Weller Logs use AI for petrophysics?
The interpretation is deterministic: published equations with documented defaults, so results are reproducible and auditable. Ryan Weller builds custom AI and machine-learning workflows for subsurface teams separately.
Can I export the results?
Yes. Computed curves export in LAS 2.0, zone summaries and curve data as CSV, and any plot as PNG.