
Quick start: well logs in five minutes
From LAS files to a cross section with tops. Everything runs in your browser; files are never uploaded.
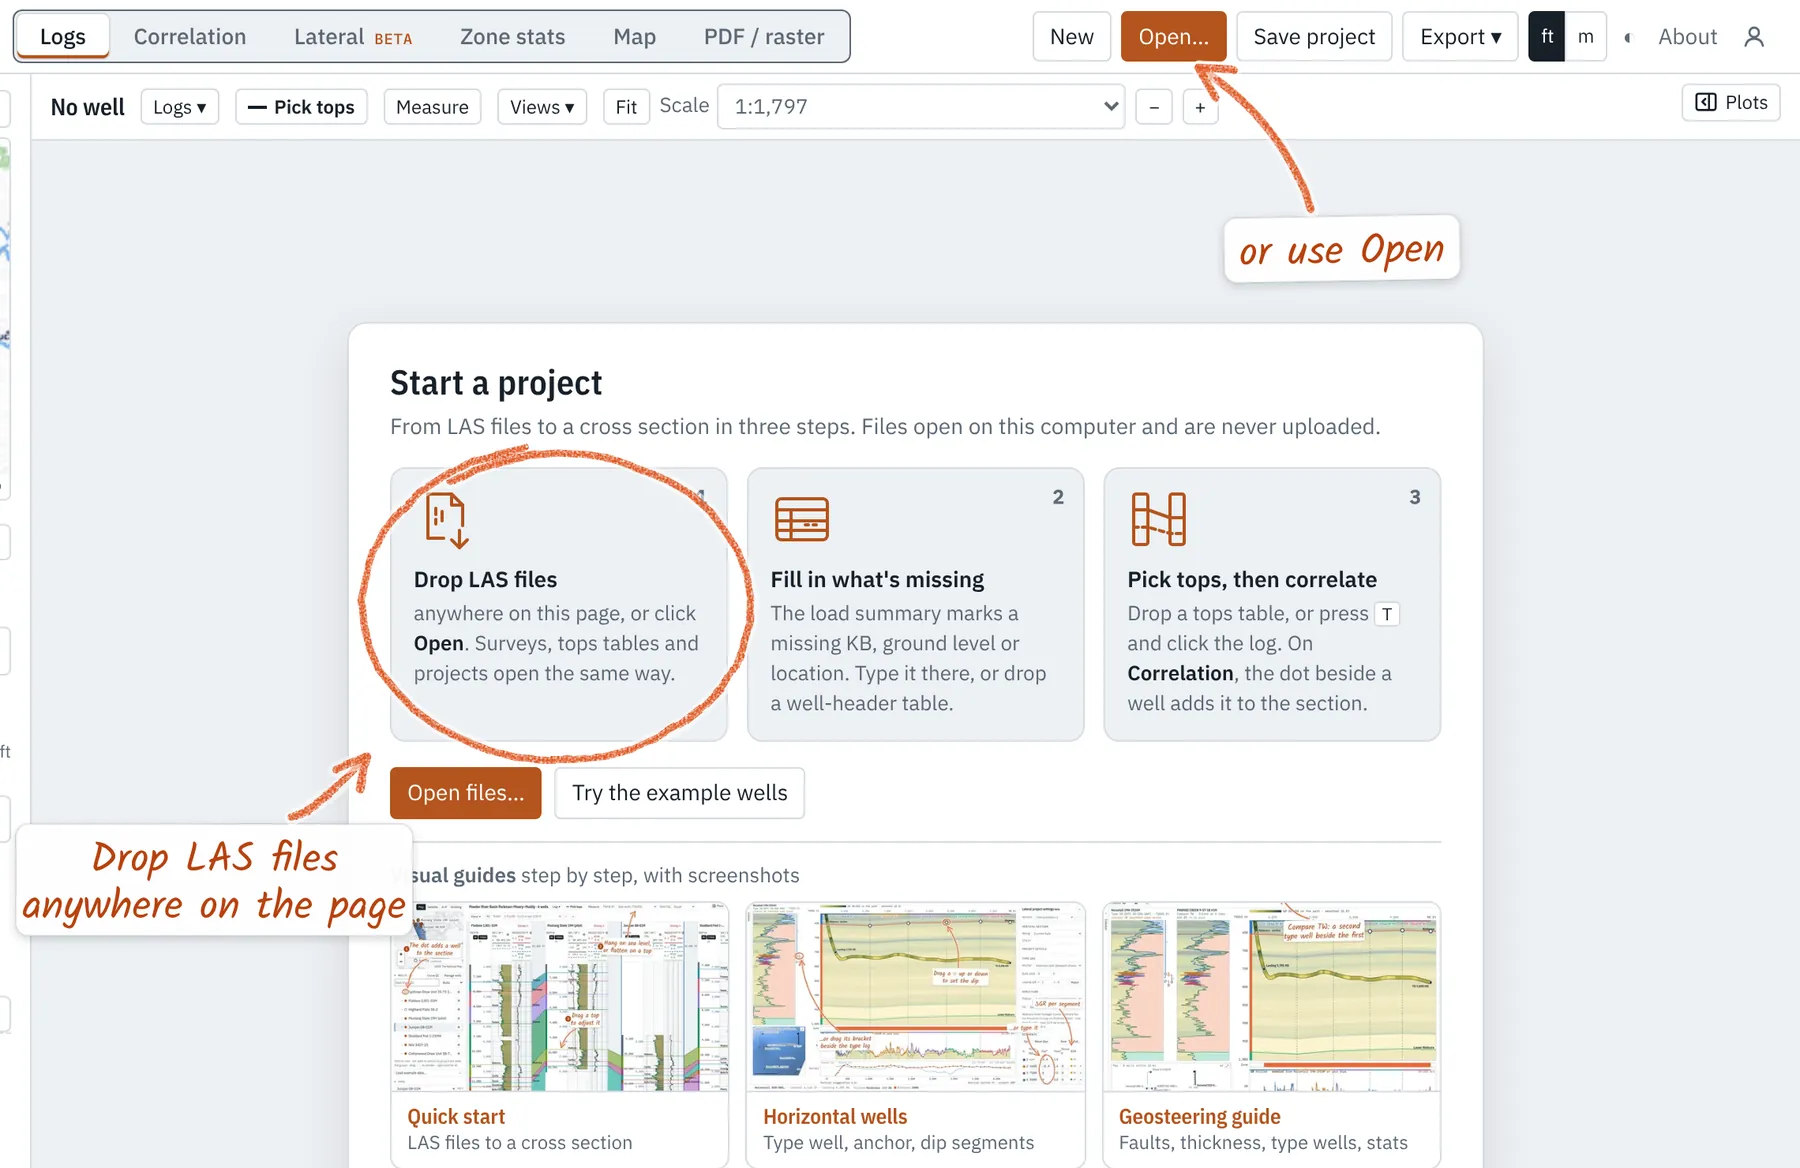
Drop LAS files
Open wellerlogs.com and choose New project. Drag your LAS files onto the page, or click Open. Select several at once: each becomes a well, and files with the same API number merge into one well. A curve name the app doesn't know (a vendor's GRAX, say) is asked about once, with a guess, and remembered for that vendor; Curve QC → Curve mappings… changes it. When two files of a well start their depths at different rig floors (or the ground), Depth zero offers the move; every height there can be edited.
Fill in what's missing
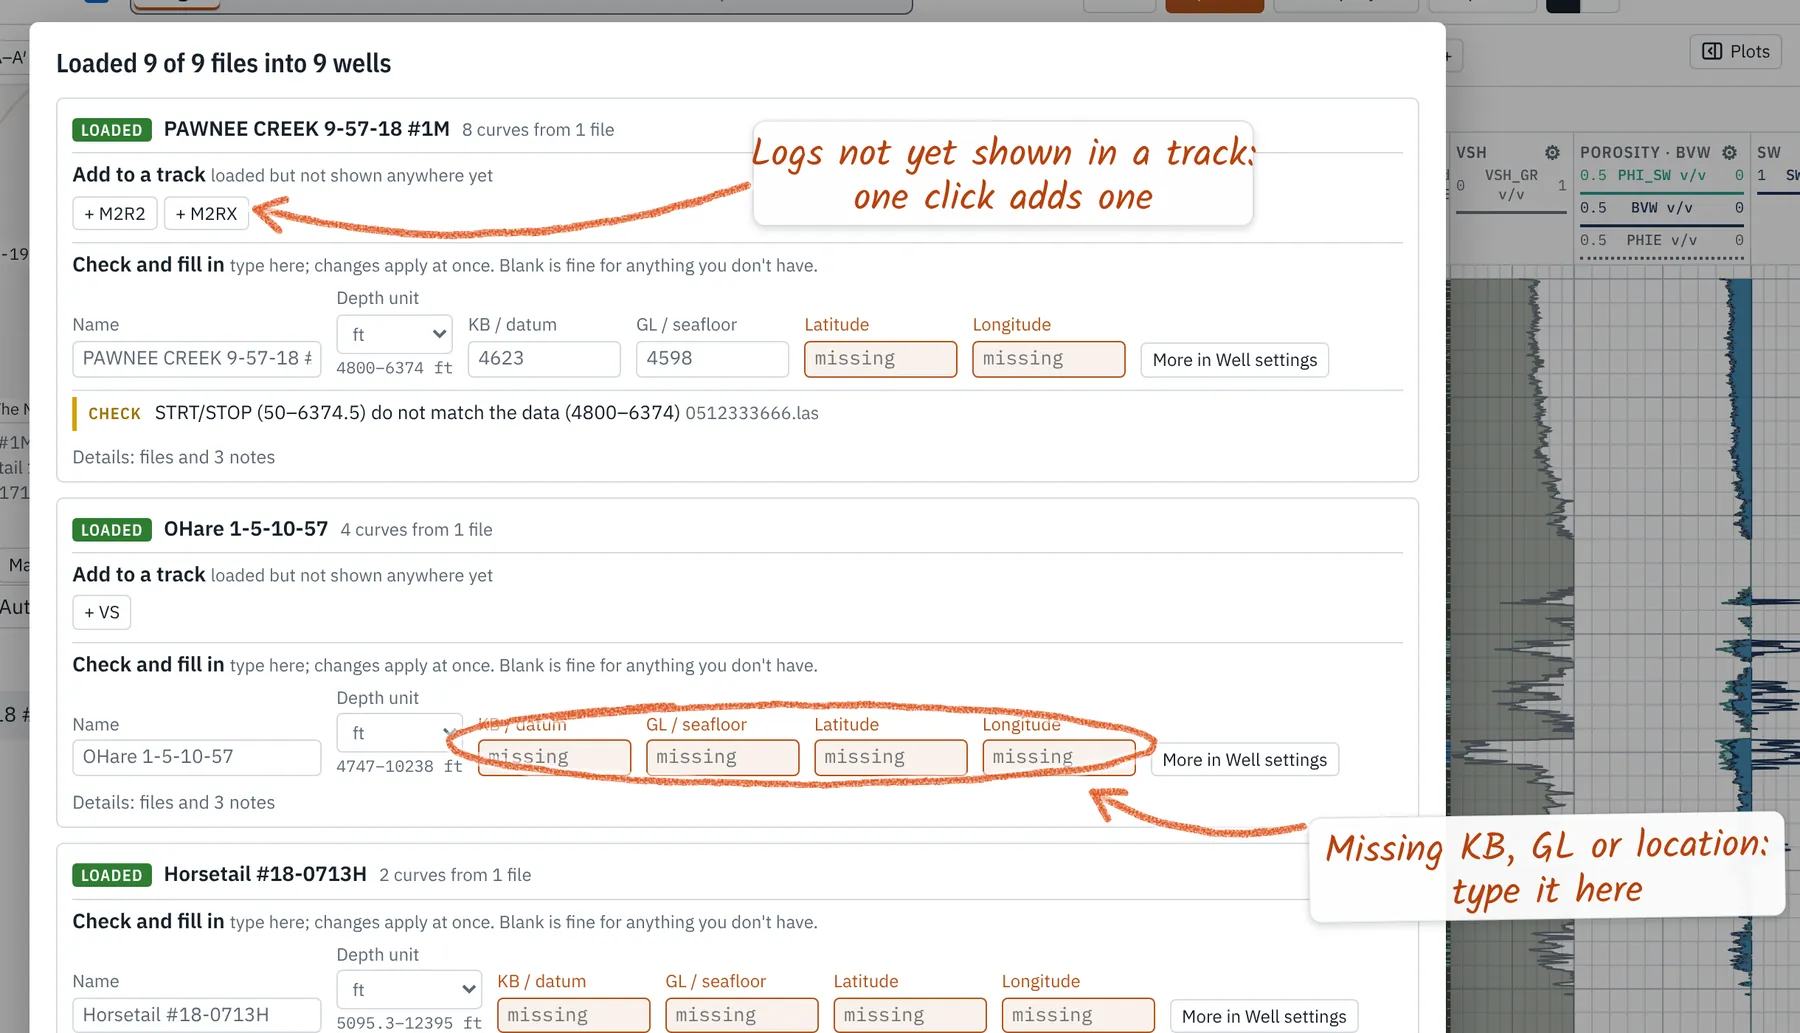
A load summary opens with one card per well. Fields the file left blank are marked missing: type the KB (or ground level) to hang on sea level, and latitude and longitude to put the well on the map. Blank is fine for anything you don't have. Under Add to a track, a + button adds a log that no track shows yet.
Bad hole is flagged for you. Washouts (caliper over bit + 1 in) and |DRHO| over 0.15 are marked in black in the Flags track on import and shaded on the density-neutron track, and the summary gives the share of the log flagged. Crossplots hide those samples.
Surveys and plans. Drop a directional survey with the LAS files and it finds its well. Grid or magnetic azimuths are turned to true north with the convergence or declination at the well (set the default north in Manage wells). A sidetrack takes its parent's survey and tops above the kick-off: set it in the well's ⚙. A directional plan loads as a plan revision, drawn dashed on the map and in Lateral; one for a well you haven't opened makes a new well. Azimuthal GR (up and down) fills between the two in the color of the hotter side.
Get headers from a table
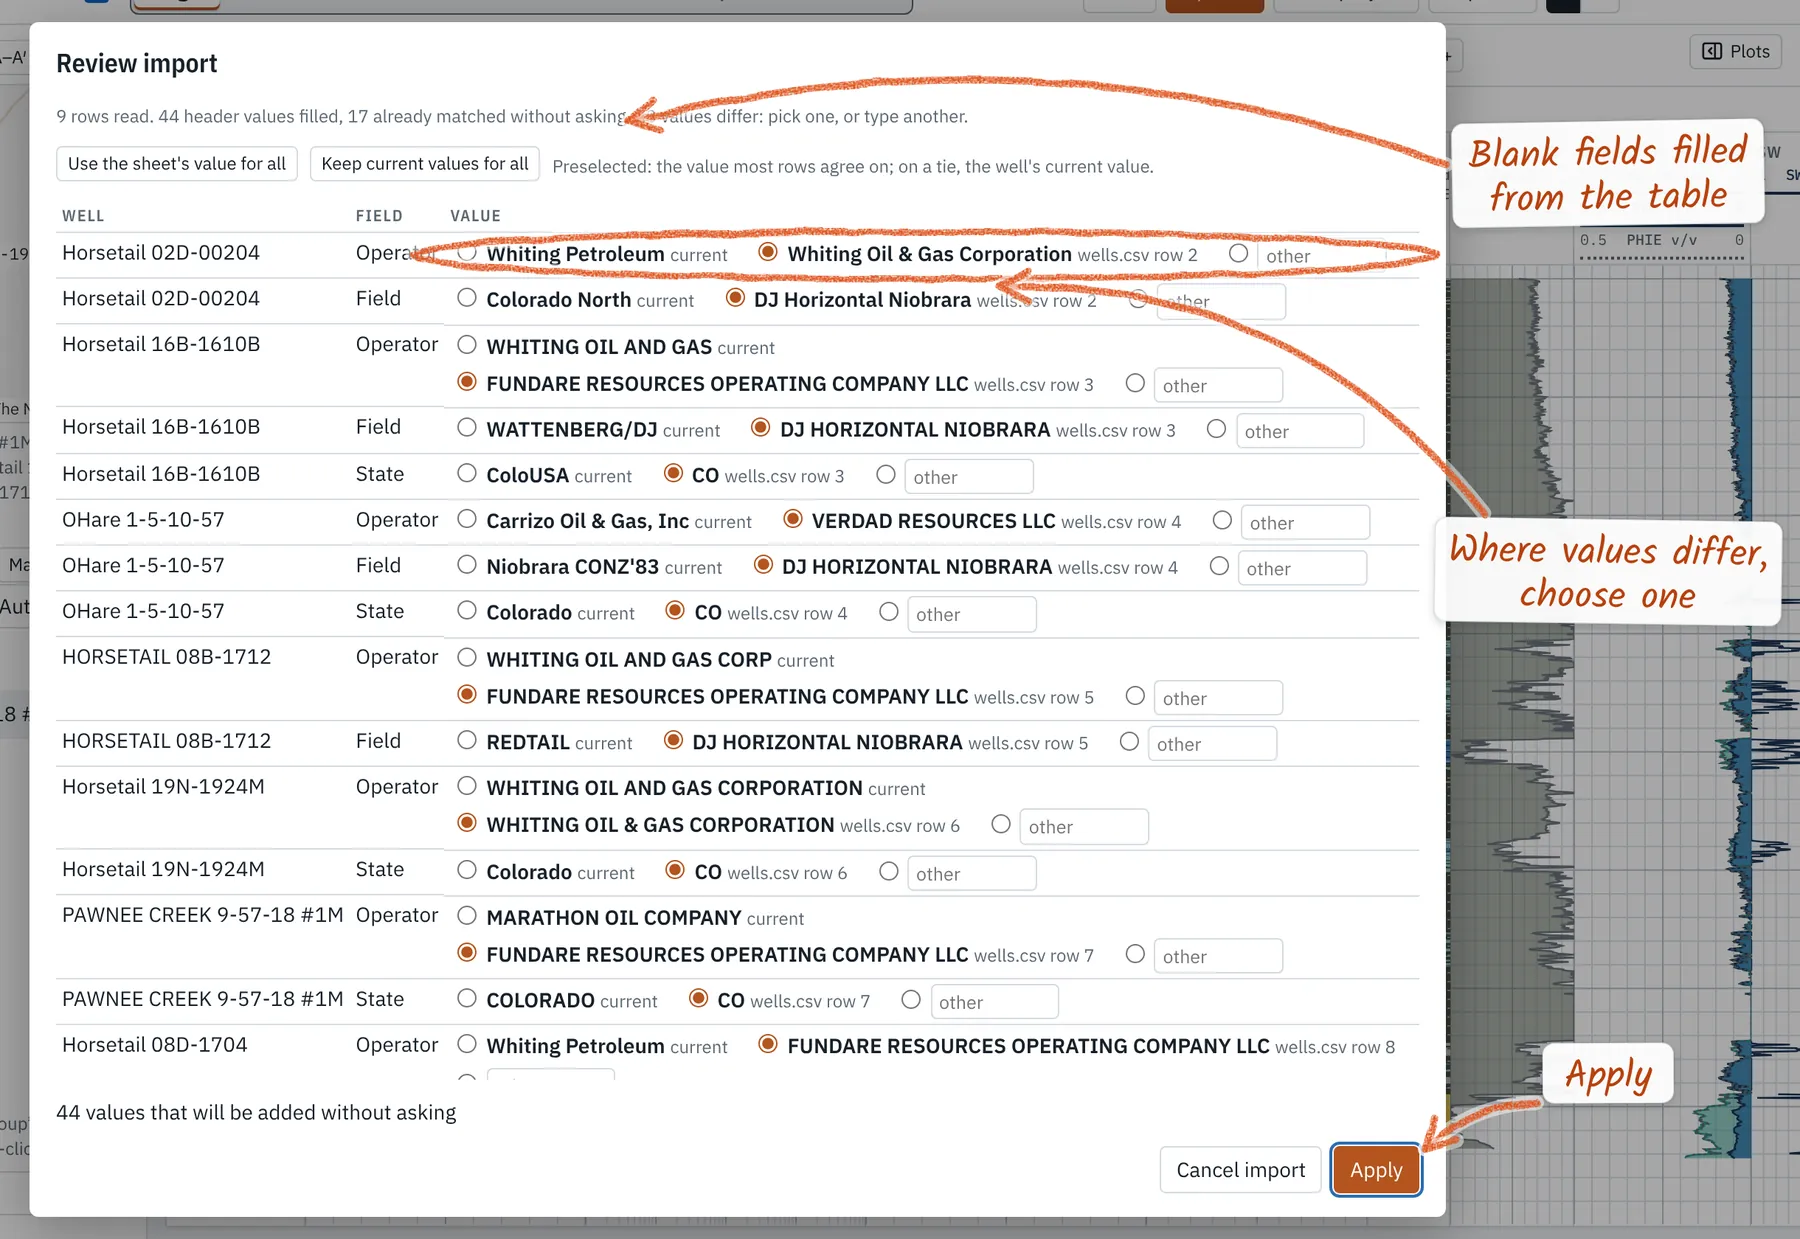
Have a well list from your database or the state? Drop it. Weller Logs reads any CSV or Excel sheet with a well name or API column and finds KB, GL, latitude, longitude, operator, county and more by their column names. Blank fields fill without asking; where the table and the file disagree, Review import lets you pick one value per well, then Apply.
Tip. Paste works too: copy cells from a spreadsheet, header row included, and press Ctrl+V (⌘+V on a Mac) anywhere in the app.
Load or pick tops
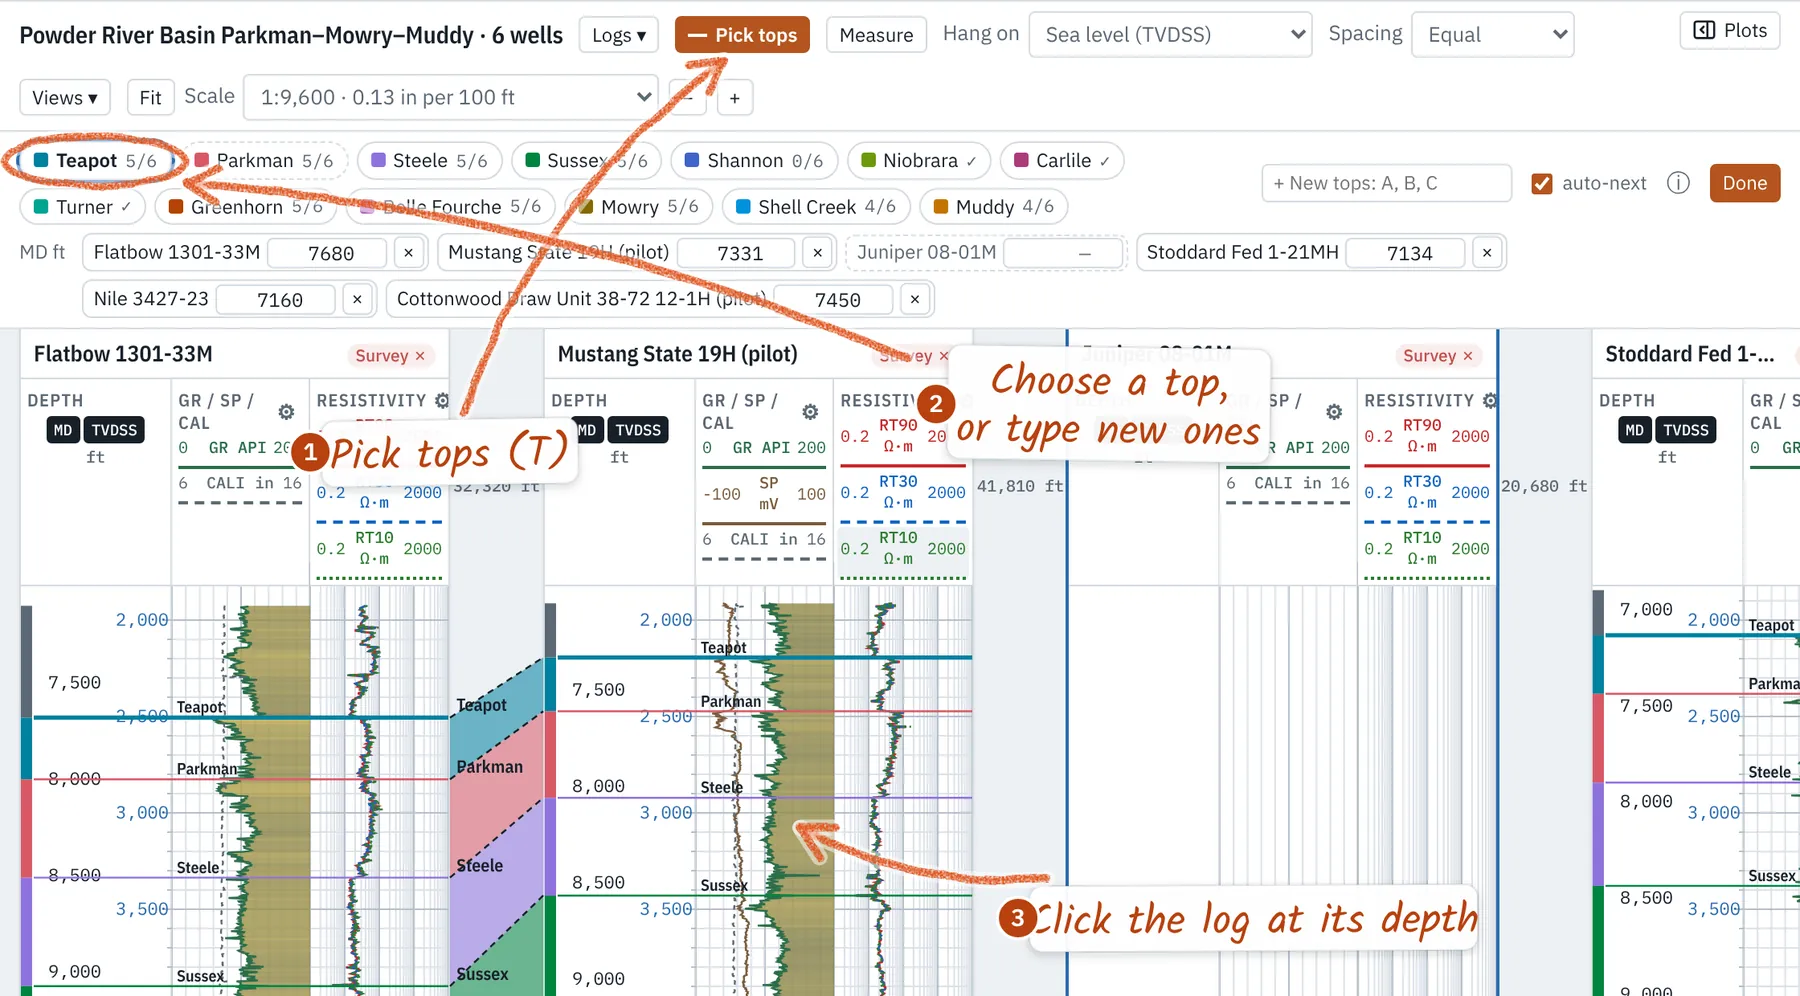
Have tops? Drop a table with well (or API), top name and MD columns; they land on every matching well. Picking your own? Press Pick tops or T. Choose a top, or type new names top to bottom with commas (Fill, Clay, Sand), then click the log where each one is. Drag a line to move it, or type an exact MD in the bar. Esc or Done ends picking. The depth scale carries on past a log's ends, so a top can go below TD where you know the formation; a loaded structure grid shows as a dashed line where it crosses each well (turn each on or off under Surfaces in the sidebar), and a click near it puts that top on it.
Point data. Core measurements, pressures, XRD or any other values at depth load the same way: a CSV or sheet with well (or API), MD, then one column per measurement, units in the header such as
k (mD). They plot as markers on any track. Labeled depths (perforations, shows) load too; a file Weller Logs can't place on its own asks What's in this file? with the columns preselected.Hang a cross section
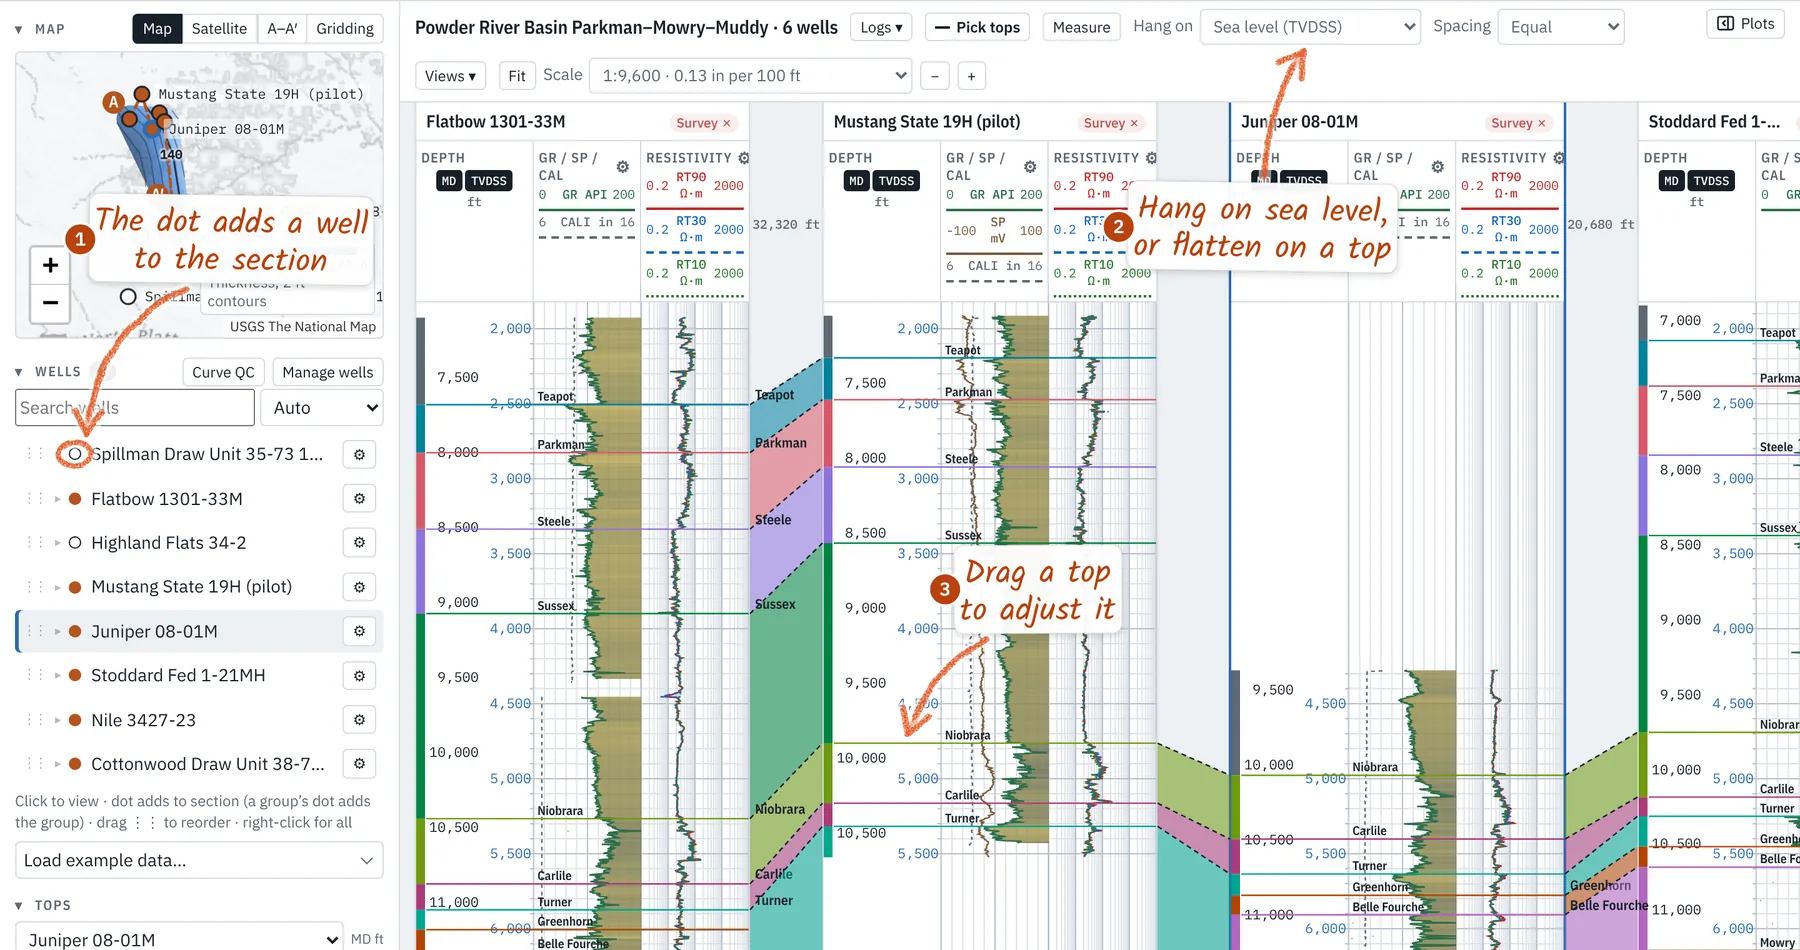
Open the Correlation tab. The dot beside each well in the Wells list adds it to the section (or click it on the map); drag wells in the list to change their order. Hang on switches between measured depth, sea level (structure) and a flattened top (stratigraphy). Tops fill between wells in the same colors as Zone stats.
Have a structure grid? Drop a ZMAP+, CPS-3 or XYZ grid, or lease polygons (x y or GeoJSON). Weller Logs finds its state-plane or UTM zone from your wells, checks it against their tops and draws it on the Map tab. Or make one from the picks: New from tops there (or a top's eye under Grids in the Lateral tab's project tree) grids a top from every well's picks and updates as wells are added; Snapshot keeps a dated copy. Each grid has a color and a show box. Gridding your own tops there, Contours every sets the interval: 20 by default, or 10, 50, 100, Auto or Custom.
Save and share
Your work is saved privately on your computer: the browser keeps your last session (Resume session brings it back), and nothing is uploaded. Save project (Ctrl+S) writes one
.lasprojfile with the logs, tops, headers, tracks and views inside, to keep or send to a colleague. Signed in on a plan, Cloud projects keeps it in your account, encrypted in storage and in transit. Export gives the view as a PNG or print pages at a chosen scale and depth range, wells as LAS, tops or zone stats as CSV, or everything as one bundle. On the Lateral tab it adds the geosteering report, with your company's logo and the well's dates, and the interpretation files, with lateral footage by zone and by height above the target base.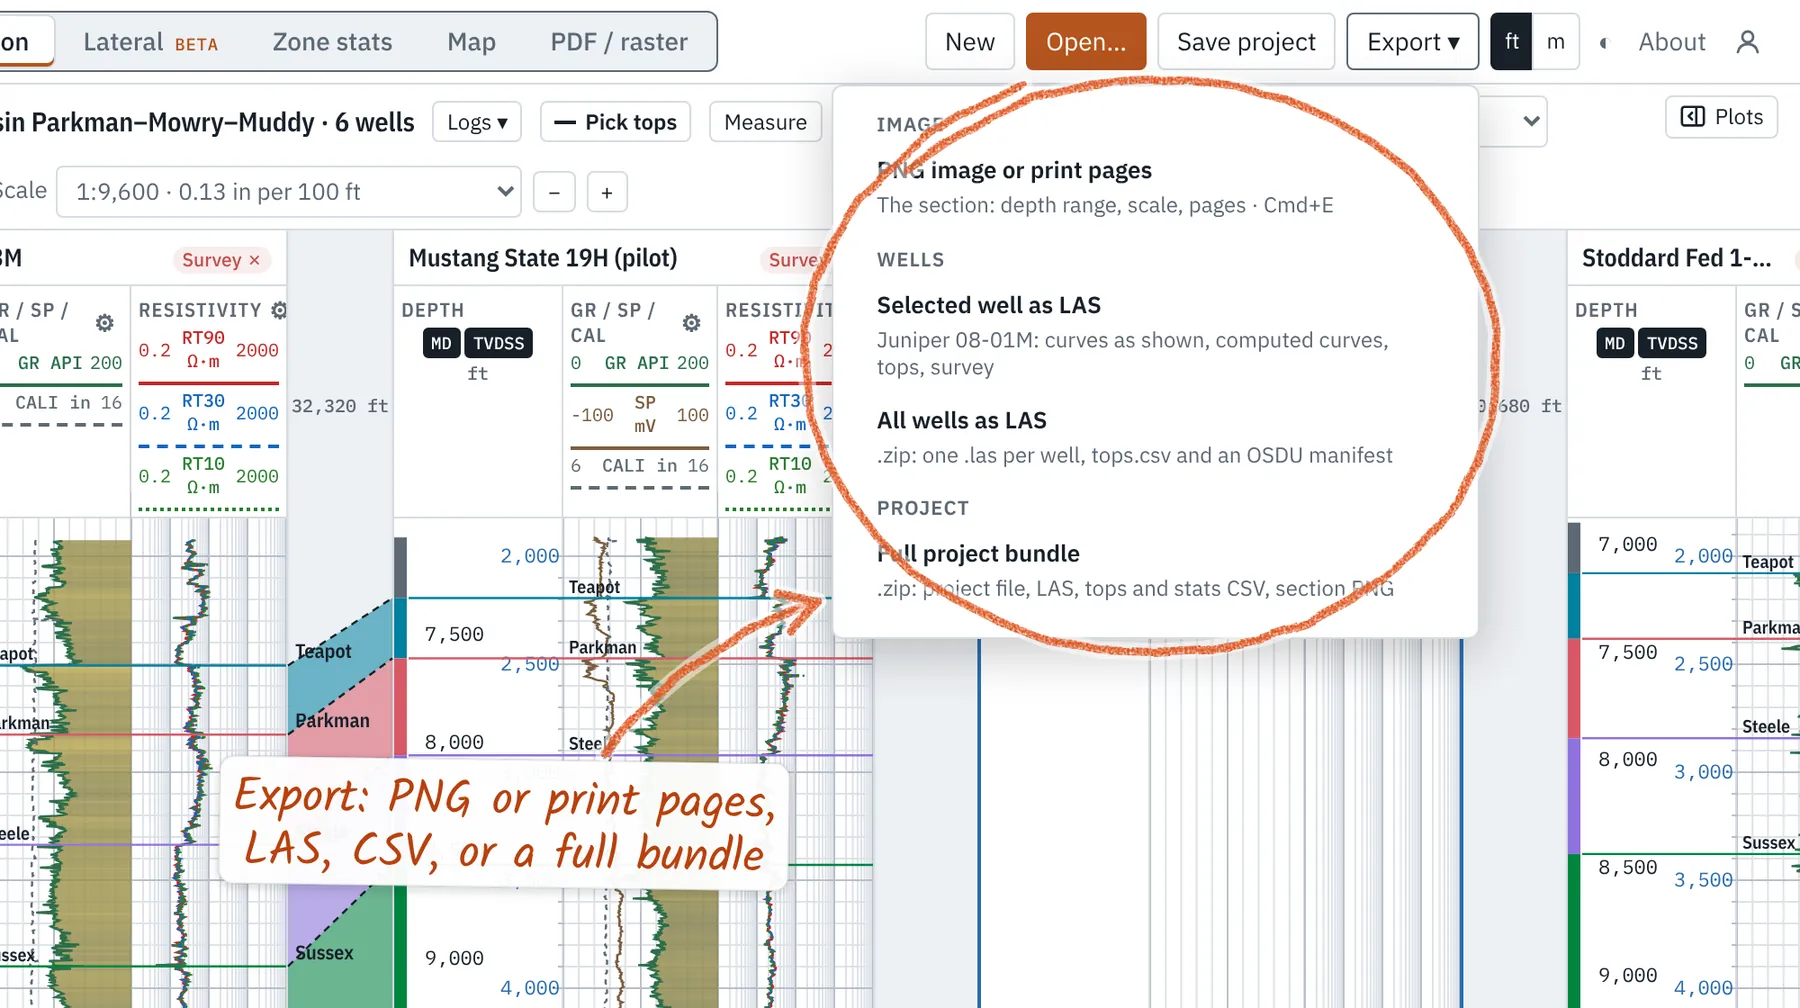
Display and track settings
On the Lateral tab, each strip's scale reads at its left edge; click its name ▾ to change it. A track's ⚙ (or right-click a log → Edit the … track) opens the track editor along the bottom; changes show on the logs as you make them. For each curve set the color, line style and width, left and right scale, a log scale, and a fill, solid or colored by value. Wrap off-scale values continues a curve from the other edge, as on a printed log. Save as my defaults keeps your track set for every new project.
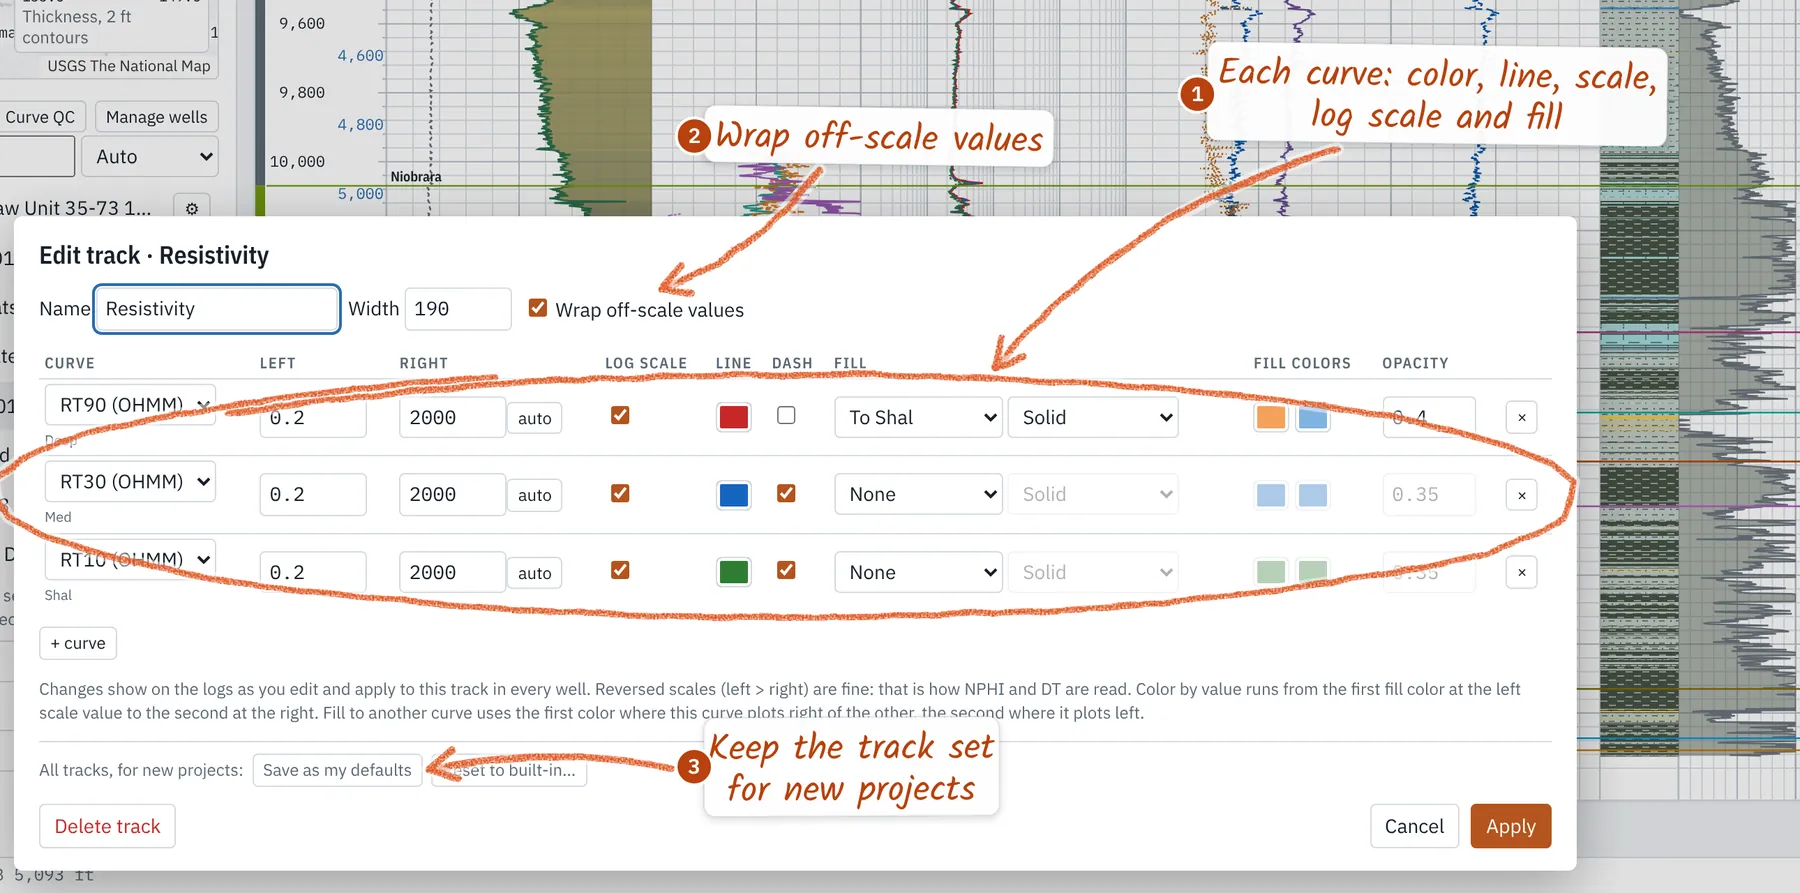
- Click a curve's scale in a track header to change just that curve: name, color, line, scale, fill.
- + track in the sidebar adds a track; Logs ▾ shows or hides any curve in the well.
- On the Lateral tab the sidebar becomes a project tree (laterals with their interpretations, logs, survey sheet and comments, type wells, grids, seismic) with Tops; hide it to a rail of icons with its button. Drilling → Survey sheet on its right-hand rail opens the survey sheet; right-click the wellbore to add a comment (a bit trip, a handover) at that depth.
- Scale sets the print ratio (1:240, 1:600…) or Fit; ft / m switches units; ◐ the dark theme.
- The Tops panel sets each top's color; Save colors as my default keeps them.
- The lithology track's ⚙ edits its cutoffs and colors, with FGDC-style patterns.
Hot keys
Zoom and scroll
- Ctrl/Cmd + scroll: zoom the log or mudlog
- Scroll: move up and down the log
- Lateral: scroll zooms, drag pans
- Lateral: double-click refits the view
- Scale − / + or Fit: set the log's scale
- iPad: pinch zooms, one finger scrolls or pans
Files and edits
- Ctrl/Cmd+O Open files
- Ctrl/Cmd+S Save project (Shift: Save as)
- Ctrl/Cmd+E Export a PNG
- Ctrl/Cmd+Z Undo (Shift: Redo)
- Esc Close or stop picking
- Right-click: options for what's under the pointer (iPad: long-press)
Picking
- T Pick tops (1–9 choose one)
- ↑ ↓ Nudge the last pick (Shift: ×10)
- [ ] Previous / next well (Logs)
- M Measure an interval
- P Plots panel
- iPad: drag a top in Pick tops